The top command is somewhat analogous to the Windows Task Manager. What it does is it gives us a snapshot of our system every 3 seconds (by default). The program output is divided into two general areas: 1) the summary section and 2) the processes section.
The top section to top begins with mostly with load averages and uptime:
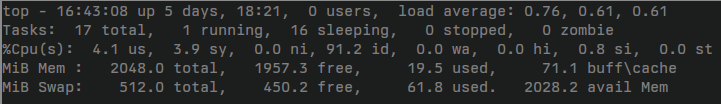
In this case the computer has been up for 5 days, 18:21 hours, zero users logged in, and a load average.
The tasks on the second line mean the following:
- Total: total tasks
- Running: how many tasks are using the CPU at this moment
- Sleeping: how many tasks are not using the CPU at this moment
- Stopped: how many tasks are in the process of closing down
- Zombie: how many parents tasks are closed with child tasks still hanging
The third line is related to data that pertains to the CPU:
us : time running un-niced user processes
sy : time running kernel processes
ni : time running niced user processes
id : time spent in the kernel idle handler
wa : time waiting for I/O completion
hi : time spent servicing hardware interrupts
si : time spent servicing software interrupts
st : time stolen from this vm by the hypervisor
The last two lines describe memory - both physical memory and swap.
Useful things:
P (uppercase P) sorts top by CPU
M (uppercase M) sorts top by Memory
k creates a prompt to kill by PID
v / shift-v allows us to change how data is sorted
d to change the update period